Can we estimate the true number of COVID-19 cases from imperfect data?
- Mark J. Panaggio
- Mar 29, 2020
- 4 min read
Updated: Apr 30, 2020
I received this question from a friend after posting the following:
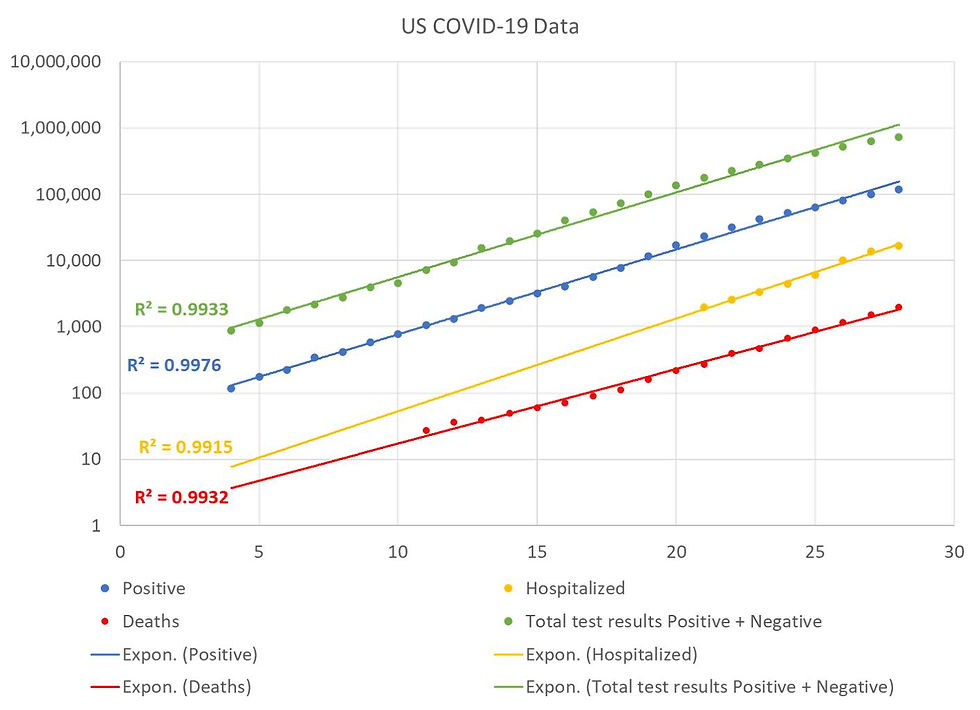
The last couple of updates on the number of US COVID-19 cases have been slightly lower than an exponential model would predict. There are lots of caveats: the number of cases is still increasing, the number of new cases each day is still increasing, but the percentage increase per day looks like it is starting to drop. Maybe this is wishful thinking, but that could be an early sign that the epidemic is leaving the exponential growth regime. If this is true, then it is good news, especially since the number confirmed cases in the US has been growing faster than any other country in the top 10 (among total cases). This could be a sign that the social distancing measures that have been adopted in many parts of the country are working or it could be a temporary blip in the data. Let's hope for the former! In case you are wondering, the data comes from: https://covidtracking.com/us-daily/
So, how do you account for testing being done inconsistently through time and across populations?
It is a great question. The short answer it that it is really hard to do! In these plots, I am not attempting to do any adjustments. So, these curves should be interpreted as the “apparent” values rather than estimates of the “true” values. Unfortunately, there is no reliable way to infer the true values from this data.
The long answer is that if you really wanted to know with confidence how many people are sick, you would need to select a random sample from the population, test everyone in the sample, adjust for the false positive and false negative rate of the test, and then you could use the estimated prevalence of COVID-19 in the sample as an estimate of the prevalence in the general population.
Unfortunately, the data we have right now is nowhere near a random sample since the people who are being tested are those who have likely been exposed (due to contact with a known infected person) or who are exhibiting symptoms consistent with infection. This means that the prevalence of the infection among people who have been tested (12-18%) is much higher than in the general population. It is quite difficult to counteract the effects of this sort of biased sampling, in fact, the only way to do that is to model the bias, but that would require knowing how the reasons why people are or are not getting tested. Ideally, you would determine how likely it is that people in different groups (not infected, infected by asymptomatic, mild symptoms, severe symptoms, deaths) will be tested as well as the number of positive tests for people in each category. I have not seen that type of data anywhere so ultimately, any attempt at correcting these results is going to require some sort of model with a bunch of assumptions.
I have been thinking about and researching the best way to do that for a couple of days, but there does not seem to be a universally accepted solution. One of the best attempts at estimating the number of cases we are missing comes from a study of the outbreak in China. In that study, they simulated the outbreak with a variety of different assumptions about the number of undocumented cases, and they found that the one that was most consistent with the trends in the data was the one with 14% of cases documented and 86% undocumented. There are a number of reasons why you can’t just assume that applies here. For starters, that study looked at the early stages of the outbreak, and the proportions started changing once testing became more widespread. Also, China took a very different approach to monitoring and controlling the spread of the virus than the US has. However, if we were to make that assumption then it would mean that the 125k documented cases we have right now correspond to somewhere around 750k undocumented cases.
One of the things I have been wondering is why there are not more attempts at using random sampling to improve our estimates. I have heard about attempts to do this in a few countries such as Iceland, the Netherlands, India and Singapore, but that seems to be the exception rather than the rule. As best I can tell, there are a number of reasons for this:
1. Random sampling is hard, especially amidst lockdowns and shelter-in-place orders.
2. It is also expensive, especially if you want to track the spread over time (you basically have to do a new study every day) and estimate the prevalence in different geographic regions.
3. It requires lots of tests and right now tests are in short supply. So, for the time being, people who are likely to have been infected get priority since that is vital for determining whether they need to be quarantined.
Hopefully we will see more attempts to do this in the future, but for now we are stuck with imperfect data. That said, the trends in both the number of cases and the number of positive tests seem to be (a) consistent with each other and (b) consistent with what would expect to see during an outbreak. Barring dramatic changes in how we decide if and when people get tested, this suggests that although the raw numbers of cases are unreliable, the trends (steady exponential growth) are likely a good representation of what is actually happening.


Comments