Observations from COVID19 data exploration
- Mark J. Panaggio
- Apr 21, 2020
- 1 min read
Updated: Apr 23, 2020
How much have the stay-at-home orders actually changed people's mobility patterns? Answer: Not as much as you might think. I have attached some plots showing the amount of time people spend in different locations relative to January and February (estimated using Google maps data). It looks like people started staying home BEFORE the stay-at-home orders were in place and in most states, those changes stabilized without the need for government intervention. Does this mean that the stay-at-home orders were unnecessary? This data certainly raises the question!


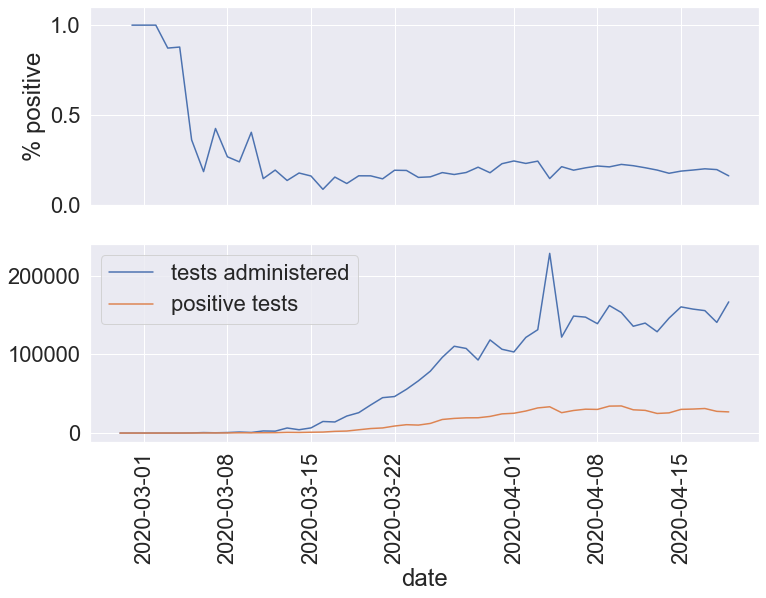


What about testing? Are we testing enough to be able to track the spread of the virus effectively and isolate newly infected people? Answer: Probably not. It looks like testing has leveled off at around 150k tests per day and meanwhile the percentage of tests that come back positive has started to increase slightly and is around 20% (which is much higher than other countries who have had success with containment). Hopefully as newer and more effective tests become available, the number of tests will start to increase again and the positive test rate will start to decline, but unfortunately we are not there yet. Here is a link to an interactive tool for viewing the data from your state.


Comments