What happens if we "reopen the economy"?
- Mark J. Panaggio
- Apr 28, 2020
- 6 min read
Updated: Apr 30, 2020
In recent days, I have heard and read that many experts believe that we are past the peak for (at least the first wave of) COVID-19 infections. There are signs that the new cases and deaths per day have leveled off and even started to go down a bit in many states. This is great news! The peak was much lower than the one experts would have expected in an unmitigated response which suggests that the measures we have all been taking to slow the spread of this virus have been at least partially successful. In other words, good work everyone! We flattened the curve!
Along with this good news, I have started hearing talk about “reopening” the economy and it got me thinking. That sure sounds nice. Wouldn’t it be great if things could get back to normal or even partially back to normal? Maybe restaurants and parks and gyms could reopen. I would love to see that happen, but is that actually a good idea?
So naturally, as a mathematician, instead of just wondering, I decided to put the idea to the test by creating a mathematical model. I decided to simulate an outbreak in a town with 50000 people total, 100 of which are infected initially, over 500 days. I used a simplified version of the type of model used to generate many of the predictions we have been hearing about. [Feel free to skip the rest of this paragraph if you are not interested in the details.] This model is called a stochastic SIR model. In this model you simulate the interactions between people that are susceptible, infected and removed (either immune or dead). In this model, I essentially flip a weighted coin for each person on each day to determine how many sick people get infected, how and how many infected people are removed. The probabilities for these transitions were computed using estimates from peer reviewed papers on COVID-19. The key parameter is the basic reproduction ratio, which measures the average number of people that each infected person will infect during the early stages of the pandemic. Estimating this parameter from data is difficult, but most estimates (e.g. https://www.ncbi.nlm.nih.gov/pubmed/32097725) place its value between somewhere above 2. So, I generated random R0 values from a normal distribution with mean 2.28 and standard deviation 0.12 to match the confidence interval from the scientific literature.
I then simulated the outbreak 100 times each for 4 different scenarios.
Let me preface these results by saying that this is meant to be a qualitative description of hypothetical scenarios. None of these scenarios are meant to be predictions for what will happen. They are intended to reveal what might happen under various possible responses.
Scenario 1: No social distancing. In this scenario I assume no one changes their behavior in response to the outbreak. You can simulate this by keeping R0 fixed throughout. This is obviously not what happened, but it is useful for understanding a worst case scenario.
Scenario 2: Social distancing (full reopen). In this scenario, I assume that after 20 days, people begin to decrease their interactions with each other. Over a 20-day period, this contact rate drops by 50% similar to what was observed in the mobility patterns collected by Google between March 11 and March 31. This low level of contact was then maintained over a 40-day period (think April 1 to May 11). At this point, the contact rate increased to normal levels over a 20-day period. These times were selected so that the reopening begins soon after the peak number of new cases is achieved in the social distanced scenario.
Scenario 3: Social distancing (partial reopen). This scenario was identical to the one above except that instead of having activity levels return to normal at the end, they returned to 75% of their normal levels.
Scenario 4: Social distancing (no reopen). In this scenario, the contact rate remains 50% lower than normal throughout the simulation.
A schematic illustrating how the contact rate (or equivalently R0) changed during the simulation is displayed below.

I decided to look at two things (1) the number of new cases on each day and (2) the cumulative total number of infections on each day. In each case I plotted the average outcome for the 100 simulations along with a 95% confidence interval (the average plus or minus two standard deviations). This can give us a sense of the range of outcomes that might be expected under each scenario.


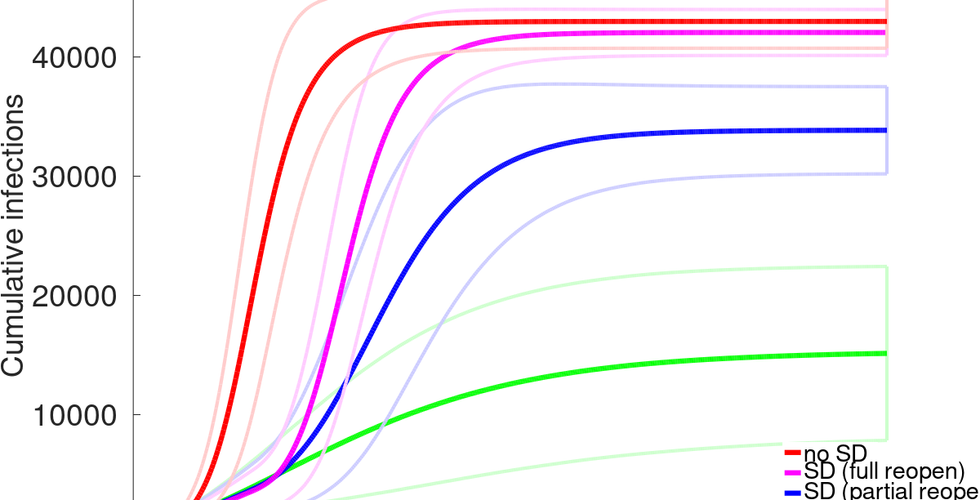
So what can we learn from these simulations? Here are a few observations:
Observation 1: Bad things happen when you do nothing. Unsurprisingly, if you don’t do anything to slow the spread of the disease, then most (around 80%) of the population gets sick.
Observation 2: Social distancing really does flatten the curve. The peak is much lower when the contact rate gets decreased by 50%. This is a plausible description of what is happening in the US right now.
Observation 3: Returning to normal behavior too soon is almost as bad as no social distancing at all. This does delay the peak, but the total number of people who get sick is not decreased by much compared to the worst-case scenario.
Observation 4: Maintaining social distancing over a long time lowers the peak and total number of infected dramatically. The question is: At what cost? A year and a half of extreme social distancing is probably not a realistic option.
Observation 5: The peak and total number of infections is very dependent on what reopening looks like. The higher the contact rate at the end, the worse the outbreak is in the long run.
The takeaway message is that, unfortunately, social distancing doesn’t address the underlying problem: there are infected people in a population with a large number of susceptible people. At the moment, our country is like a pile of kindling, ready to burn if exposed to a spark. Right now, there are small fires burning all over the place. We can try to restrict the airflow to keep the fire from growing too large, but as long as the embers remain, the fire will flare up as soon as airflow resumes. The only way to address this problem is to put out the embers or remove the kindling.
In the context of COVID-19, we can do this by removing infected people (by quarantining them or treating them so that they recover more quickly) or removing susceptible people (by vaccinating them so that they are immune). At the moment, I see little evidence that we are ready to do either of those things. Models like this one reveal that a premature return to normal patterns of behavior will undo most of the progress that we have made over the last 6 weeks.
Obviously, we cannot remain locked down forever. It is worth thinking carefully about things we can do to reclaim some sense of normalcy without dramatically increasing our risk of a second exponential wave of infections. Do lock-downs need to be mandatory or can we allow some freedom while still encouraging people to stay home as much as possible? I do not know the answer to those questions. But what I do know is that simply going back to normal because social distancing is difficult and we are “past the peak” would have serious consequences. I hope that the government officials will take these consequences into consideration when deciding how and when to “reopen the economy.”
PS After sharing this article with a friend, I got the following response: "That full reopen after distancing scenario is more sobering than I thought it might be." I agree. I wasn't sure how it was going to turn out, and I was not expecting that scenario to turn out quite so bad. However, I should point out that I don't think any of these hypotheticals are completely realistic.
I think that even if lockdowns were lifted, many people would proceed with caution by continuing to wash hands, wear masks, keep their distance, etc. So of the three reopening scenarios, the partial reopening scenario is probably the most realistic depiction of what would happen if lockdowns were lifted. The magnitude of the rise in R0 will very much depend on the messages people receive from (and examples set by) local and government officials, scientists and the media. I also think that if the number of new cases picks up again, people will realize what is happening and change their behavior again in response.
The main takeaway message of these results should be that the idea that we can return to a pre-COVID-19 normal in the near future without dire consequences is pure fantasy. It may be possible to resume some activity, but that must be done with care to avoid a rebound in cases.
PPS You should also keep in mind that this model was intended to describe a localized outbreak, not an outbreak on a national scale. To accurately describe the time scale and extent of a national outbreak would require taking into account network effects, which is not something I tried to do here. To see a more sophisticated model that takes into account these effects, take a look at the model from the Network Science Institute at Northeastern University.


Comments